Cable has finally made the break of the monthly low and made a run towards its average daily range.
Other GBP crosses have followed.
Therefore, MANY pairs have a strong short/mid-term outlook.
Look for SHORTS.
Regards.

Statistic and Probabilistic Trading
Showing posts with label Forex AUD Euro GBP EURO CHF EURUSD USDCHFEURUSD #EURUSD Ausssie AUDUSD #AUDUSD FX Trading USD Dollar Oil Prices Assets Gold Equities. Show all posts
Showing posts with label Forex AUD Euro GBP EURO CHF EURUSD USDCHFEURUSD #EURUSD Ausssie AUDUSD #AUDUSD FX Trading USD Dollar Oil Prices Assets Gold Equities. Show all posts
Wednesday, July 6, 2011
Thursday, June 30, 2011
#GBPUSD
Cable broke a bearish wedge formation that could be observed on the 30min, hourly time frames.
If price coses NY session close to todays low, we will have better chances for an expansion downwards tomorrow as well.
If price coses NY session close to todays low, we will have better chances for an expansion downwards tomorrow as well.
#EURNZD Pullback Entry
Nice entry on the pullback for this cross.
Trade in the direction of the months trend, the weeks trend and the days trend. Perfect combination.
Very tight SL already yielding good profit during the early hours of NY.
Lets see where it takes us.
;-)
Trade in the direction of the months trend, the weeks trend and the days trend. Perfect combination.
Very tight SL already yielding good profit during the early hours of NY.
Lets see where it takes us.
;-)
Tuesday, June 28, 2011
#GBPUSD Outlook
The Pound continues its way down since the trend line that extended from the low of Jan 31st on was taken out. It appears to be channeling down on the 60 min time frame. It also has reached a support level @ 1.5936. This support probably won't last too long as this pair seems to be destined to head to lower levels.
The daily chart demonstrates the closet support levels. While 1.6058 is the closest resistance level.
The weekly charts shows price action inside a triangle consolidation pattern. If July does not exceed the high of the year so far, most likely we will see this pair go for that lower trend line.
We could be bullish for another day, however, downtrend will most-likely resume.
I expect this pair to change the main move of the year before its the end of the year.

The 60 min. chart showing price action inside a channel. Lower lows are expected.

The daily chart showing some support/resistance levels as well as the Measured Objective Target for the broken pattern.

The weekly chart showing price inside a triangle pattern.
#USDCHF
The Franc has been a safe haven for those wishing to avoid risk in this period of uncertainty. However, It's of my belief,as stated many times earlier, that the risk aversion will be shifted to the USD very soon.
The charts below, indicate some reversal patterns.
The daily chart demonstrates price action inside a bullish wedge consolidation formation. It also portrays two clear MACD bull divergences (white dotted lines).
The 240 min. chart denotes a diamond formation (inside the wedge) in which price has been touched by a supportive trend line that extends from the low of the 5th of June and most-likely will be taken out thus breaking the formation south of the border. We can also observe a breakaway gap that was formed earlier today indicating that is some strong USD selling pressure. However, that gap will be covered sooner than later. Let me remind you that there is also a gap on the USDx. The bottom of that gap (USDx) will act as support. Likewise, the top of this act will act as resistance.
The 60 min. chart. shows a smaller wedge formation (violet) as well as a MACD bull divergence pointing towards an initial MINIMUM target of 0.8474.
The fundamental explanation to this is that risk is well diversified throughout the world with great turmoil in the US, in the EURO zone, the BRICS have recessions under way and China's (apart from the others in BRICS) picture is very uncertain as of now. Therefore, buying a major currency at this 'bargain' price makes all the sense in the world to me since all other currencies are overvalued considering the present economical picture.

The daily chart showing the two wedge formations as well as the MACD bull divergences. Targets are denoted in the white dotted lines.

The 240 min chart demonstrating a supportive trend line that extended from the 5th of June being penetrated. Most likely, price will seek new highs pretty soon.
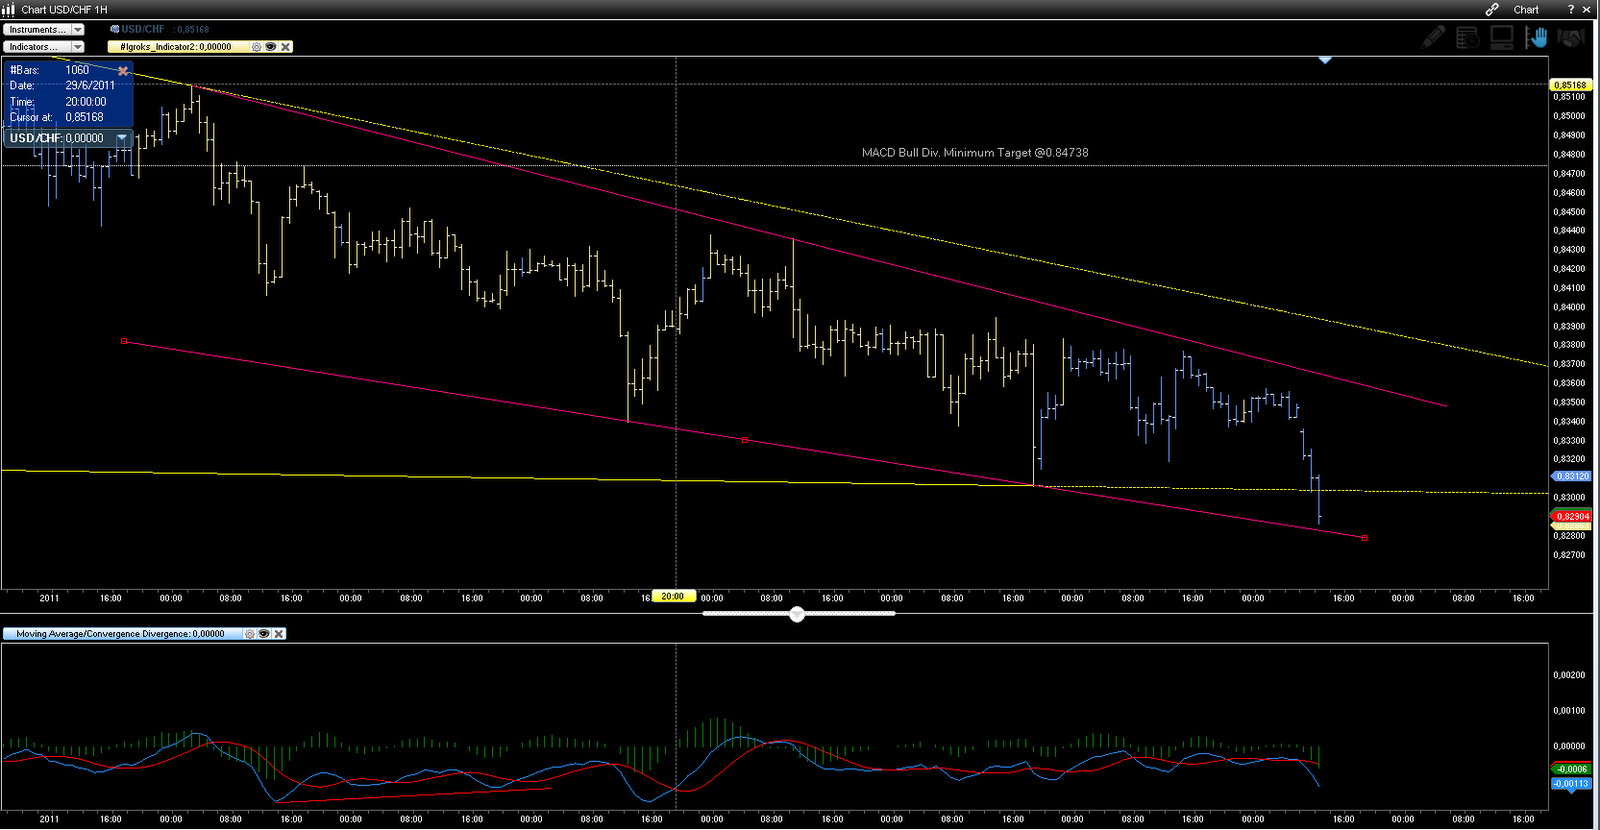
The 60 min chart showing the smaller wedge (violet) as well as the gap. This gaps bottom @ 0.8342 will serve as initial resistance.
Monday, June 27, 2011
#USDx and #EURUSD
As the MACD divergences posted earlier came into play, both USDx and Euro changed the main move of the day.
This is just a temporary delay for an imminent break that most likely is is about to occur during this week.
This is just a temporary delay for an imminent break that most likely is is about to occur during this week.
Wednesday, June 22, 2011
#EURUSD
EURUSD has a higher probability to extend its average daily trading range to the north. Initial traget reside in the 1.4492 level. Most likely will follow the other majors before its begins to go down. Lets ait as there is news in a few minutes.
Thursday, June 16, 2011
#Dow Jones, #GBPUSD, #EUR and #USD
The Dow Jones has broken two historical ascending trend lines. These trend lines were part of a diamond formation observed on the daily charts. This reversal formation has an initial MINIMUM target of 10.900 points. However, it probably will head much lower.
Cable had reached a KEY trend line today. It's the neckline of a HUGE Head & Shoulders formation that can clearly be observed on the H4 and daily charts. Actually I have posted this picture here before as well as the positional trade I took at the peak of the right shoulder.
The Euro has FULLY formed a HUGE (very symmetrical) diamond formation that can be observed on the monthly chart. This will send this pair to much lower levels. I REPEAT once again that below parity is a MUST for EURO in the subsequent years.
USDx is touching and actually testing the descending trend line of a channel observed on the daily/weekly charts. It most likely will breakout upwards sooner than later. As mentioned MANY times here, the buck will surge for the following years. I have published the multiple bull targets here in my blog.
I am still preparing the article that explains all of this and the thought process behind it
Stay tuned.
Wednesday, June 15, 2011
#USDx MACD Bull Target # 1 Reached
USDx MACD bullish divergence MINIMUM target reached @75.33. We had an incredible 200+ range today and the weekly range for the buck is at 100%. Most likely, we will see 'range' trading for it tomorrow.
As promised I will publish a piece regarding the rise of the dollar, the fall of the Euro, the fall of the equities and some other 'connected' issues.
Cheers to all and stay tuned.
As promised I will publish a piece regarding the rise of the dollar, the fall of the Euro, the fall of the equities and some other 'connected' issues.
Cheers to all and stay tuned.
#EURUSD & #GBPUSD
Euro has changed its weekly main move (trend) to down. The pound will follow soon. However or whenever it may be, choose to take trade in the direction of the main move.
We have news later on today. However, we might not see a big expansion anymore as the USDx has completed and surpassed it average daily range already with 107% plus.
** the Eruo aldo changed the main move of the month.
We have news later on today. However, we might not see a big expansion anymore as the USDx has completed and surpassed it average daily range already with 107% plus.
** the Eruo aldo changed the main move of the month.
#USDx Next Correction Level
Next correction level for USDx is 75.33.
I am developing a piece on the USD, commodities, equities and other pairs.
This will/might be a shock to many, but I will post my complete view here today.
Cheers to all and happy trading.
I am developing a piece on the USD, commodities, equities and other pairs.
This will/might be a shock to many, but I will post my complete view here today.
Cheers to all and happy trading.
Another One in #CADJPY
This was a double diagonal "beast". I wasn't quite doing any technical analysis on this pair before my system took one pullback trade on it today. But than, I saw this one, that at first, looked like an angled inverted head and shoulders. I wasn't able to see it fast enough as to maintain the position towards the minimum objective target.
Notice how the two turquoise lines are very, very parallel to each other.
A true beauty that reversed price action.

Notice how the two turquoise lines are very, very parallel to each other.
A true beauty that reversed price action.

The hourly chart demonstrating a double-diagonal diamond.
Tuesday, June 14, 2011

#EURUSD & #USDx
USDx and Euro showind short term descending trendlines on the m15 and m30 charts. MACD bear divergence for EURO pointing towards todays low. Possible short term counter measures during Asia time.
Will post charts later on.
Will post charts later on.
Sunday, June 12, 2011
Contrarian Moves Early Asia
Most likely, USDx, Majors and some crosses will cover gaps and some divergences present. Than, most likely they will change the main move as the BUCK will most-likely demonstrate gains throughout the remainder of the trading week.
Lets see.
Lets see.
Friday, June 10, 2011
#EURUSD Chart
Here goes one of the EURUSD charts:


The 15 min. chart demonstrating the bearish flag (as mentioned earlier) as well as other trades taken this week.
#USDCHF Chart
Here is the charts for Swissy:


The 30 min. chart showing a few trading opportunities this week.
#Majors Multiple Breakouts #GBPUSD, #EURUSD, #USDCHF & #AUDUSD
As posted earlier on my twitter page and here : http://mcapitalmarkets.blogspot.com/2011/06/usdx-and-pairs-update.html , the due flag breakouts did occur as expected:
GBPUSD: Took the fastest fall as its weekly average range was rather small til the first part of european session. Is probably done for the day as its average daily range has been exceeded by some 30+ %. Changed the weekly and the monthly main move to DOWN today as expected and posted earlier. We are approaching the original neckline of the H&S formation. Stay sharp.
EURUSD: Kept on falling with this breakout. Main move of the month is still UP, however, will be taken out soon. 1.4364 seems to be a first logical target for this pair. Still some room to go down during NY session.
USDCHF: Also continuing its correctional path. Main move of the month is still down. However, it will be taken out and changed to UP sooner than later. A second entry opportunity was present at pullback (intraday).
AUDUSD: Changed its main move (WEEK/MONTH) to DOWN yesterday. Breakout made a pullback which provided a second chance for an entry for those who missed the initial break.
I will post charts on these later on.
Cheers and happy trading.
Subscribe to:
Posts (Atom)